Acquire analog data
The Sound Card can sample the voltage on its analog inputs at 1 kHz and stream each sample to Bonsai together with the current sound parameters. Refer to the connections article to set up an analog signal on ADC0, which we will use for the rest of these examples.
Note
Pure tone playback from the internal sine wave generator is currently limited (as of firmware v3.0) to the Right Channel. Connect the amplifier and speaker to this channel if you plan to play pure tones.
This article covers how to enable the analog data stream and visualize the analog data in Bonsai.
The complete workflow is shown below. Copy and paste it into Bonsai to get started immediately, or build each section by following the step-by-step instructions in the following sections.
Enable analog data stream
The analog data stream is off by default, enable it by configuring EnableAdcControlState.
- Insert a
KeyDownoperator and set theFilterproperty toA. - Insert a
CreateMessageoperator and configure the following properties:Payload- SelectEnableAdcControlStatePayload.EnableAdcControlState- SelectEnabledto enable the analog data stream. To disable it in the future, selectDisabled.
- Insert a
MulticastSubjectoperator namedSoundCard Commands.
Run the workflow and press A. The device starts reporting AdcControlState events, which we will cover in the next section.
Visualize analog data
Each AdcControlState event carries five values:
| Field | Description |
|---|---|
Adc0 |
The sampled value on ADC0. |
Adc1 |
The sampled value on ADC1. |
AttenuationLeft |
The last left channel attenuation that was set |
AttenuationRight |
The last right channel attenuation that was set |
Frequency |
The last sound index or frequency played |
The workflow below will show you how to decode and visualize the events, and plot one channel:
- Insert a
SubscribeSubjectoperator namedSoundCard Events. - Insert a
Parseoperator and set theRegisterproperty toTimestampedAdcControlState. - Insert a
VisualizerWindowoperator.
To plot only one of the input channels:
- Insert a
MemberSelectoroperator on a separate branch from theParseoperator and set theSelectorproperty toValue.Adc0. This selects the data from the first analog input channel. - Insert a
VisualizerWindowoperator and set theVisualizerTypeproperty toTimeSeriesVisualizer.
Run the workflow and press A to enable the stream. The first visualizer displays the whole payload followed by the timestamp in seconds:
AdcControlStatePayload { Adc0 = 6, Adc1 = 7, AttenuationLeft = 0, AttenuationRight = 0, Frequency = 2 }@6.973344
AdcControlStatePayload { Adc0 = 6, Adc1 = 7, AttenuationLeft = 0, AttenuationRight = 0, Frequency = 2 }@6.974344
The second visualizer plots the Adc0 value over time as a 12-bit value:
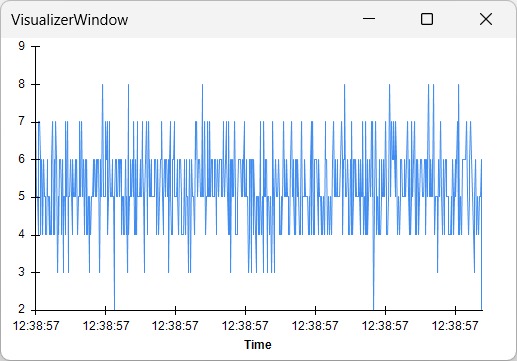
Vary the output voltage of the external device to see the plot change.
Note
The attenuation and frequency fields report the last commands sent from Bonsai. Sounds triggered from the digital inputs will overwrite the attenuation levels, but will not update these fields.
Documentation for release v3.0.0